
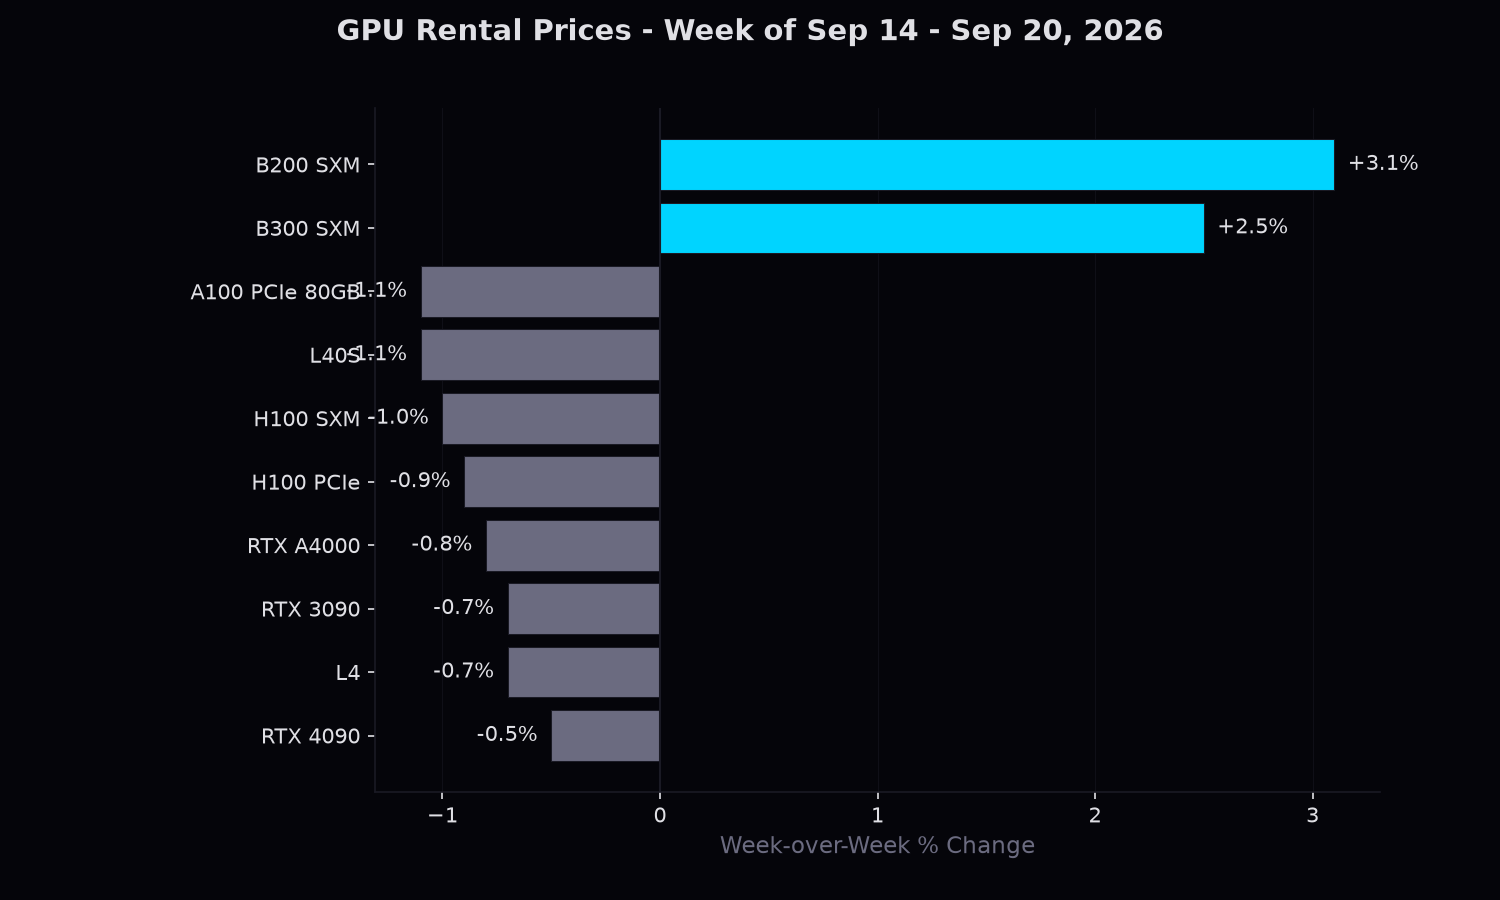
The NVIDIA B200 SXM posted a 3.1% week-over-week increase in median hourly rental rates, moving from $6.23 to $6.42, according to AIMC observations. That single-point move masks meaningful dispersion across individual marketplaces: the spread between the lowest and highest listed rates this week spans more than a dollar per GPU-hour, a gap that carries material implications for operators sourcing at scale. The analysis that follows breaks down where B200 SXM is currently priced across each tracked marketplace, how individual platforms have shifted relative to last week's baseline, and how wide that inter-marketplace spread has become. All figures reflect listed spot rates at time of observation and do not account for reservation discounts, commitment tiers, or negotiated enterprise terms.
This Week in Numbers
- Focus SKU: B200 SXM
- Week-over-week move: +3.1% ($6.23 → $6.42 median across covered marketplaces)
- Marketplace coverage: 12 marketplaces, 150 observations this week
- Price range: $3.69/hr at deepinfra to $8.19/hr at togetherai
AIMC tracked B200 SXM across 12 authorized marketplaces this week. Full partner list at aiminingco.com/data-partners.
B200 SXM — Pricing by Marketplace
| Marketplace | Min | Median | Max | Observations |
|---|---|---|---|---|
| deepinfra | $3.69 | $3.69 | $3.69 | 7 |
| hydrahost | $4.25 | $4.25 | $4.25 | 7 |
| ionet | $4.99 | $4.99 | $4.99 | 7 |
| upcloud | $5.20 | $5.20 | $5.20 | 7 |
| massedcompute | $5.43 | $5.43 | $5.43 | 7 |
| cirrascale | $5.99 | $5.99 | $5.99 | 7 |
| hyperstack | $6.00 | $6.00 | $6.00 | 7 |
| verda | $6.23 | $6.42 | $6.62 | 45 |
| lambda | $6.69 | $6.69 | $6.69 | 7 |
| runpod | $6.79 | $6.79 | $6.79 | 35 |
| arkane | $7.99 | $7.99 | $7.99 | 7 |
| togetherai | $8.19 | $8.19 | $8.19 | 7 |
Spread Analysis
Across the 12 marketplaces carrying B200 SXM this week, the observed median ranged from $3.69/hr at deepinfra to $8.19/hr at togetherai — a 2.2x spread between the lowest and highest median. Intra-SKU spreads of this magnitude reflect differences in commitment terms, regional availability, and how aggressively each provider is positioning the same hardware, rather than differences in the silicon itself. AIMC reports each marketplace's observed median independently and does not blend them into a single figure that would mask this dispersion — the spread itself is part of what the market is telling you.
Observation depth for B200 SXM this week totaled 150 listings across 12 marketplaces. Marketplaces with deeper listing counts contribute more stable medians; those represented by a single listing are shown for completeness but carry correspondingly less weight in interpreting where B200 SXM is clearing.
What This Means
The most notable feature of B200 SXM pricing this week is not the headline movement but the extraordinary spread underneath it. Ai Mining Co. tracked 12 active marketplaces quoting B200 SXM compute, and the gap between the lowest and highest observed median was not marginal — DeepInfra's median of $3.69 sat more than two dollars below the next cluster of providers, while Together AI's median of $8.19 represented a 2.2x premium over that floor. A spread of this width, sustained across a dozen distinct providers simultaneously, suggests that buyers are not encountering a unified commodity market. Instead, the data is consistent with a landscape where commitment structure, contract duration, and access tier differ materially from one marketplace to the next — even when the underlying hardware is nominally identical. Whether the lower-end quotes reflect reserved or volume-committed capacity, geographic concentration in lower-cost infrastructure regions, or simply aggressive early positioning by certain providers, AIMC's data does not allow a definitive determination. What the data does suggest is that the label "B200 SXM pricing" currently describes a range of distinct purchasing contexts rather than a single clearing price.
The week-over-week median increase of 3.1% across the B200 SXM cohort adds modest texture to that picture, though it should be read carefully. A single-week movement of that magnitude sits within the range of normal fluctuation attributable to provider-level inventory shifts, spot availability changes, or catalog updates, and no single-week reading establishes a directional pattern. What it does confirm is that the aggregate midpoint of the market moved upward during the observed period, which is notable primarily because the dispersion remained wide even as the median drifted. That combination — a rising median alongside persistent spread — indicates that the pricing gap between providers like DeepInfra and Together AI did not compress materially during the week. Whether that spread reflects durable structural differences or transient availability dynamics cannot be resolved from one observation window.
This snapshot is precisely that: a snapshot. One week of data across 12 marketplaces describes where prices were observed, not where they are heading or why they sit at current levels. The analytical value of this week's B200 SXM data lies in documenting that a hardware cohort often discussed as a homogeneous tier is, in practice, being priced with 2.2x variation across accessible commercial channels — a fact that carries implications for how procurement conversations are framed, regardless of what subsequent weeks may show.
Methodology & Coverage
This weekly report is generated from pricing data collected daily across all authorized data partners listed at aiminingco.com/data-partners. Coverage includes on-demand rates published by each marketplace. Spot pricing, reserved instance rates, and enterprise contracts are excluded.
For complete methodology, data collection schedule, and quality controls, see aiminingco.com/methodology.
This report contains observable market data only. No estimates, no forecasts, no buy/sell recommendations.