The NVIDIA L40S shed 2.0% week-over-week, with its observed median hourly rate declining from $1.49 to $1.46 according to Ai Mining Co. observations. That move, modest in isolation, sits against a backdrop of notable dispersion: L40S listings currently span a meaningful price range across the active rental marketplaces where the card appears, and the gap between the lowest and highest available rates is wide enough to matter operationally for buyers sizing multi-node deployments. The analysis that follows documents where L40S is priced on a per-marketplace basis, quantifies the spread between floor and ceiling rates, and contextualizes this week's directional shift within the cross-platform picture that Ai Mining Co. tracks on a rolling basis.
This Week in Numbers
- Focus SKU: L40S
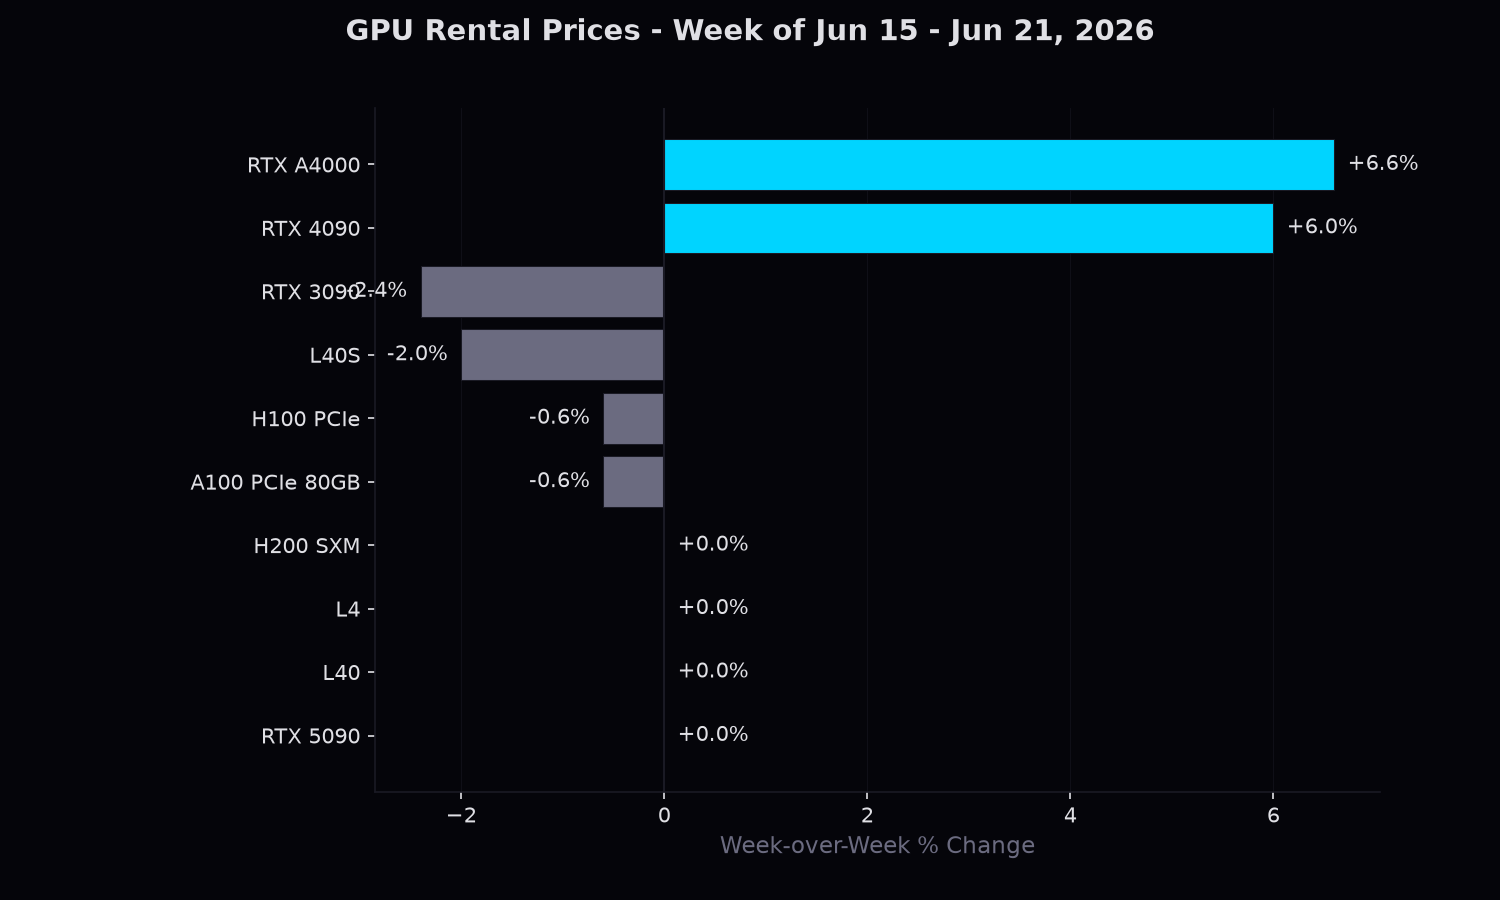
- Week-over-week move: -2.0% ($1.49 → $1.46 median across covered marketplaces)
- Marketplace coverage: 13 marketplaces, 502 observations this week
- Price range: $0.48/hr at tensordock to $2.48/hr at qubrid
AIMC tracked L40S across 13 authorized marketplaces this week. Full partner list at aiminingco.com/data-partners.
L40S — Pricing by Marketplace
| Marketplace | Min | Median | Max | Observations |
|---|---|---|---|---|
| tensordock | $0.48 | $0.48 | $0.48 | 1 |
| cloudrift | $0.63 | $0.63 | $0.63 | 7 |
| hydrahost | $0.59 | $0.81 | $1.19 | 70 |
| runpod | $0.86 | $0.86 | $0.99 | 44 |
| massedcompute | $0.88 | $0.88 | $0.88 | 37 |
| ionet | $0.89 | $0.89 | $0.89 | 7 |
| packet | $0.92 | $0.92 | $0.92 | 7 |
| upcloud | $1.27 | $1.27 | $1.27 | 7 |
| cyfuture | $1.26 | $1.29 | $1.31 | 28 |
| verda | $1.37 | $1.37 | $1.37 | 28 |
| thunder | $1.49 | $1.49 | $1.49 | 7 |
| ovhcloud | $1.44 | $1.62 | $7.43 | 252 |
| qubrid | $2.48 | $2.48 | $2.48 | 7 |
Spread Analysis
Across the 13 marketplaces carrying L40S this week, the observed median ranged from $0.48/hr at tensordock to $2.48/hr at qubrid — a 5.2x spread between the lowest and highest median. Intra-SKU spreads of this magnitude reflect differences in commitment terms, regional availability, and how aggressively each provider is positioning the same hardware, rather than differences in the silicon itself. AIMC reports each marketplace's observed median independently and does not blend them into a single figure that would mask this dispersion — the spread itself is part of what the market is telling you.
Observation depth for L40S this week totaled 502 listings across 13 marketplaces. Marketplaces with deeper listing counts contribute more stable medians; those represented by a single listing are shown for completeness but carry correspondingly less weight in interpreting where L40S is clearing.
What This Means
The most striking feature of this week's L40S dataset is not the headline price movement but the extraordinary range of rates observed across the 13 marketplaces Ai Mining Co. tracked. The median hourly rate declined 2.0% week-over-week, a modest contraction that on its own would suggest relative stability. But that figure obscures a pricing landscape that spans from $0.48 per hour on TensorDock to $2.48 per hour on Qubrid — a 5.2x spread between the floor and ceiling of the same GPU model in the same week. AIMC's data shows that this degree of dispersion is not a marginal artifact of outliers; it reflects structurally different market positions taken by providers offering the L40S at nearly every price tier in between. Platforms like TensorDock operating at the lower end of the range may reflect higher inventory density, spot-style commitment structures, or competitive pressure in segments where buyers are price-sensitive and flexible on terms. Platforms at the upper end, including Qubrid, may be positioned toward buyers who require guaranteed availability, contractual terms, or integrated service layers — though the data does not confirm the specific drivers behind any individual provider's pricing.
What this spread suggests is that the L40S, as a GPU class, does not behave as a commodity with a single discoverable market price. Instead, the 13-marketplace distribution implies that buyers and providers are transacting under meaningfully different conditions — likely varying by reservation length, geographic region of deployment, platform overhead, and service tier — even when the underlying hardware is nominally identical. A 5.2x range is wide enough that the median alone carries limited descriptive power for any individual buyer seeking a specific configuration. The distance between TensorDock's $0.48 and mid-range providers sitting in the $1.00–$1.50 band is itself substantial, and suggests that the lower end of the market may reflect very different access conditions than the middle.
It is important to note that this analysis describes a single week's snapshot. One observation period establishes neither a trend nor a stable baseline. The 2.0% week-over-week decline in median pricing and the 5.2x dispersion range characterize what the market looked like during this specific window, and subsequent weeks may show contraction or expansion of that spread, or movement in the median, without any of those outcomes being predictable from the current data alone.
Methodology & Coverage
This weekly report is generated from pricing data collected daily across all authorized data partners listed at aiminingco.com/data-partners. Coverage includes on-demand rates published by each marketplace. Spot pricing, reserved instance rates, and enterprise contracts are excluded.
For complete methodology, data collection schedule, and quality controls, see aiminingco.com/methodology.
This report contains observable market data only. No estimates, no forecasts, no buy/sell recommendations.