
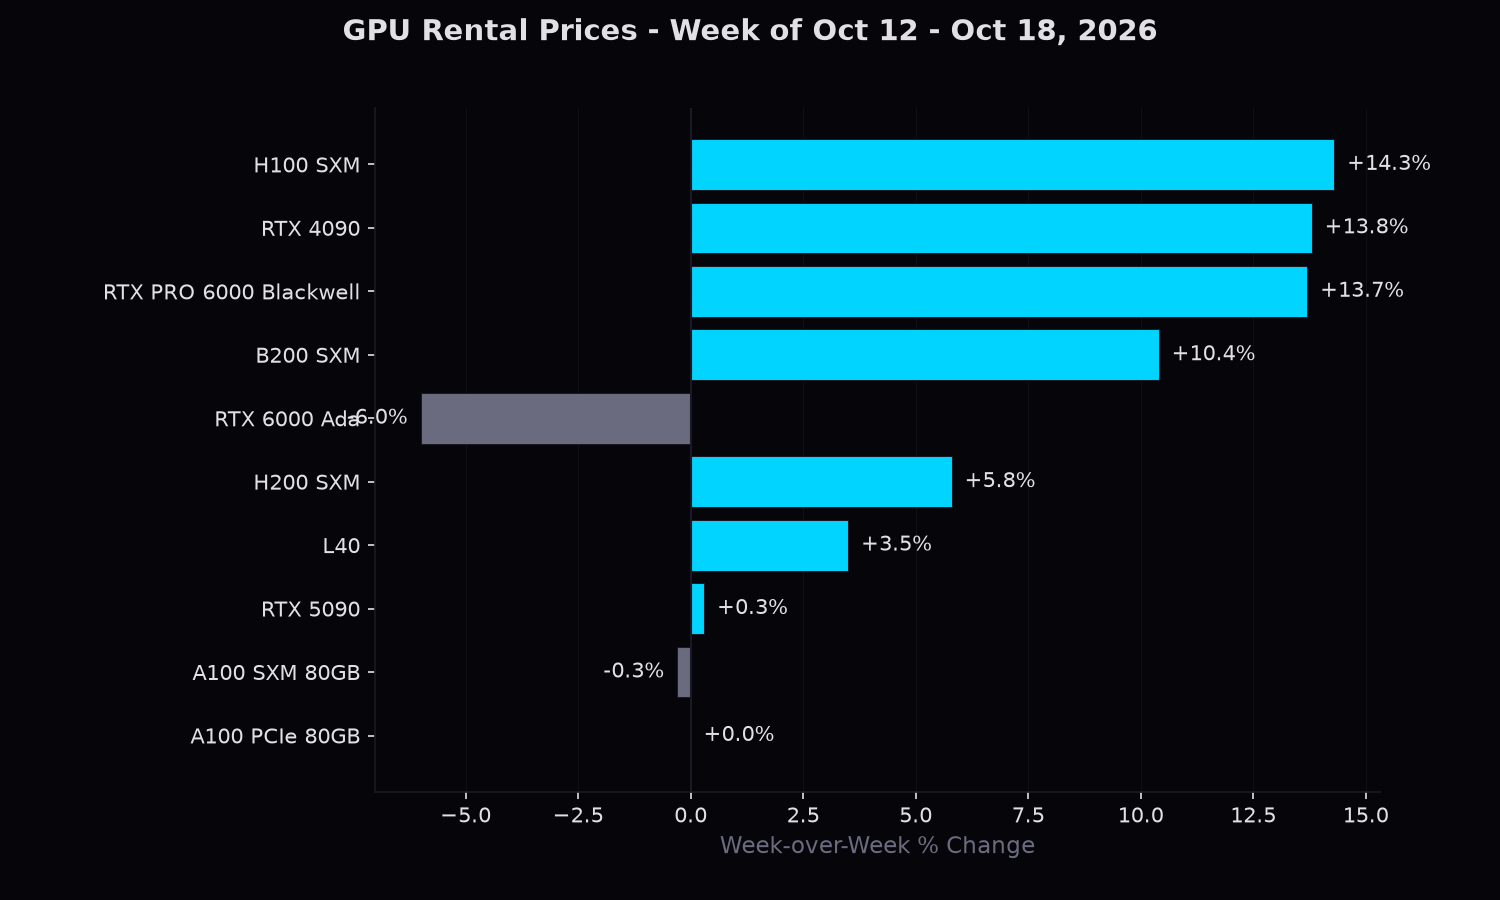
The H100 SXM recorded a 14.3% week-over-week increase in median rental price, moving from $3.49 to $3.99 per GPU-hour, according to AIMC observations. That single-week move represents the sharpest upward shift logged for this SKU in the current tracking period. The analysis that follows examines where H100 SXM inventory is currently listed across individual cloud and bare-metal marketplaces, what each platform is asking at the low, median, and high end of its available listings, and how wide the spread between the cheapest and most expensive observed offers has become. Pricing dispersion across providers remains a central data point for institutional buyers managing allocation decisions at scale.
This Week in Numbers
- Focus SKU: H100 SXM
- Week-over-week move: +14.3% ($3.49 → $3.99 median across covered marketplaces)
- Marketplace coverage: 20 marketplaces, 328 observations this week
- Price range: $1.92/hr at dataoorts to $10.00/hr at huggingface
AIMC tracked H100 SXM across 20 authorized marketplaces this week. Full partner list at aiminingco.com/data-partners.
H100 SXM — Pricing by Marketplace
| Marketplace | Min | Median | Max | Observations |
|---|---|---|---|---|
| dataoorts | $1.92 | $1.92 | $1.92 | 7 |
| ionet | $2.09 | $2.09 | $2.09 | 7 |
| deepinfra | $2.20 | $2.20 | $2.20 | 7 |
| hydrahost | $2.25 | $2.25 | $2.25 | 7 |
| theta | $2.29 | $2.29 | $2.29 | 7 |
| upcloud | $2.50 | $2.50 | $2.50 | 6 |
| akash | $2.56 | $2.56 | $2.56 | 7 |
| openrelay | $2.60 | $2.60 | $2.60 | 7 |
| synpixcloud | $2.78 | $2.78 | $2.79 | 35 |
| massedcompute | $3.14 | $3.14 | $3.14 | 14 |
| hyperstack | $3.20 | $3.20 | $3.20 | 14 |
| cyfuture | $3.30 | $3.39 | $3.46 | 28 |
| togetherai | $3.99 | $3.99 | $3.99 | 7 |
| lambda | $3.99 | $3.99 | $3.99 | 7 |
| runpod | $3.99 | $3.99 | $3.99 | 91 |
| arkane | $3.99 | $3.99 | $3.99 | 7 |
| verda | $4.05 | $4.17 | $4.30 | 35 |
| oblivus | $4.31 | $4.31 | $4.31 | 7 |
| fal | $4.50 | $4.50 | $4.50 | 7 |
| huggingface | $10.00 | $10.00 | $10.00 | 21 |
Spread Analysis
Across the 20 marketplaces carrying H100 SXM this week, the observed median ranged from $1.92/hr at dataoorts to $10.00/hr at huggingface — a 5.2x spread between the lowest and highest median. Intra-SKU spreads of this magnitude reflect differences in commitment terms, regional availability, and how aggressively each provider is positioning the same hardware, rather than differences in the silicon itself. AIMC reports each marketplace's observed median independently and does not blend them into a single figure that would mask this dispersion — the spread itself is part of what the market is telling you.
Observation depth for H100 SXM this week totaled 328 listings across 20 marketplaces. Marketplaces with deeper listing counts contribute more stable medians; those represented by a single listing are shown for completeness but carry correspondingly less weight in interpreting where H100 SXM is clearing.
What This Means
The most striking feature of this week's H100 SXM data is not the headline number but the distribution sitting beneath it. Ai Mining Co. tracked H100 SXM pricing across 20 separate marketplaces and recorded a median weekly move of +14.3%, but that aggregate figure obscures a dispersion that arguably tells a more textured story. AIMC's data shows median per-GPU-hour pricing spanning from $1.92 on Dataports to $10.00 on Hugging Face — a 5.2x spread across the same underlying hardware, within the same seven-day window. A spread of that width across a single SKU suggests that buyers on different platforms are not purchasing an equivalent product in any practical sense. Commitment structure, contract length, geographic node location, support tier, and queue priority likely all contribute to why two buyers could pay $1.92 and $10.00 respectively for nominally identical silicon. The data does not allow us to isolate which of those variables is doing the most work, and it would be a mistake to assign a single cause to a multi-variable signal. What we can observe is that the spread exists and that it is substantial.
The positioning of individual platforms across that range is itself worth noting. Dataports anchoring the low end and Hugging Face sitting at the ceiling may reflect differences in how each platform structures its offering — spot-like access with fewer guarantees on one end, managed or reserved capacity with reliability premiums on the other — but the data alone does not confirm this. What the 5.2x spread does suggest is that no single price currently functions as a market-clearing reference for H100 SXM. Buyers navigating this landscape face a market in which the same GPU identifier corresponds to meaningfully different commercial arrangements depending on where they source it, and the numeric difference between those arrangements is not marginal.
One week of data describes a snapshot, not a trend, and that constraint matters here. The +14.3% median move and the observed dispersion are facts about this specific measurement window. Whether the spread is widening, narrowing, or stable over time cannot be determined from a single observation, and what appears notable this week may look different against a longer baseline. What this week's data does establish clearly is that the H100 SXM market is fragmented across its pricing surface — not a uniform market with noise at the edges, but a structurally dispersed one where the range itself is part of the signal.
Methodology & Coverage
This weekly report is generated from pricing data collected daily across all authorized data partners listed at aiminingco.com/data-partners. Coverage includes on-demand rates published by each marketplace. Spot pricing, reserved instance rates, and enterprise contracts are excluded.
For complete methodology, data collection schedule, and quality controls, see aiminingco.com/methodology.
This report contains observable market data only. No estimates, no forecasts, no buy/sell recommendations.